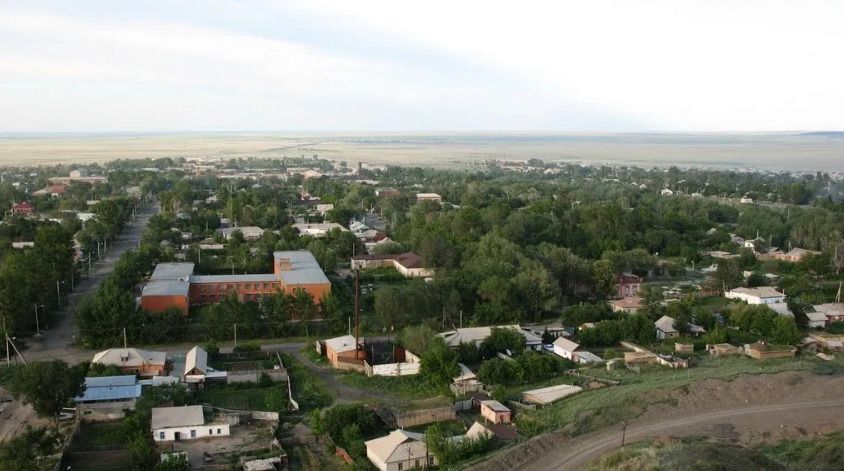
According to the RSE Kazhydromet, the temperature background in the city of Zaisan changed as follows during the long-term observation period.
January — the absolute minimum is -44.0 °C (1911), the absolute maximum is 9.5 °C (1940).
February — the absolute minimum is -40.4 °C (1951), the absolute maximum is 10.8 °C (1953).
March — the absolute minimum is -37.0 °C (1912), the absolute maximum is 24.3 °C (1989).
April — absolute minimum of -19.0 °C (1904), absolute maximum of 33.0 °C (2003).
May — the absolute minimum is -12.0 °C (1931), the absolute maximum is 35.8 °C (1974).
June — absolute minimum 0.0 °C (1903), absolute maximum 39.1 °C (2012).
July — absolute minimum 6.0 °C (1903), absolute maximum 42.0 °C (1989).
August — absolute minimum of 2.0 °C (1912), absolute maximum of 41.1 °C (1979).
September — the absolute minimum is -2.3 °C (2002), the absolute maximum is 37.8 °C (1998).
October — the absolute minimum is -20.0 °C (1928), the absolute maximum is 32.8 °C (1985).
November — the absolute minimum is -38.1 °C (1952), the absolute maximum is 17.4 °C (1988).
December — the absolute minimum is -43.0 °C (1929), the absolute maximum is 12.1 °C (1955).
Kazhydromet RSE specialists continuously monitor the climate system, analyze temperature changes and other meteorological indicators. Long-term observations make it possible to track climate trends, inform the population in a timely manner and increase preparedness for possible climate risks.